01DemonstrationMission operations
Concept
Mission data and interactive visualization
Data & visibility · 3D visualization- Problem
- Operators need events from several sources in one view, with the source and time of each event visible, so they can see what needs attention and act on it.
- Working behavior
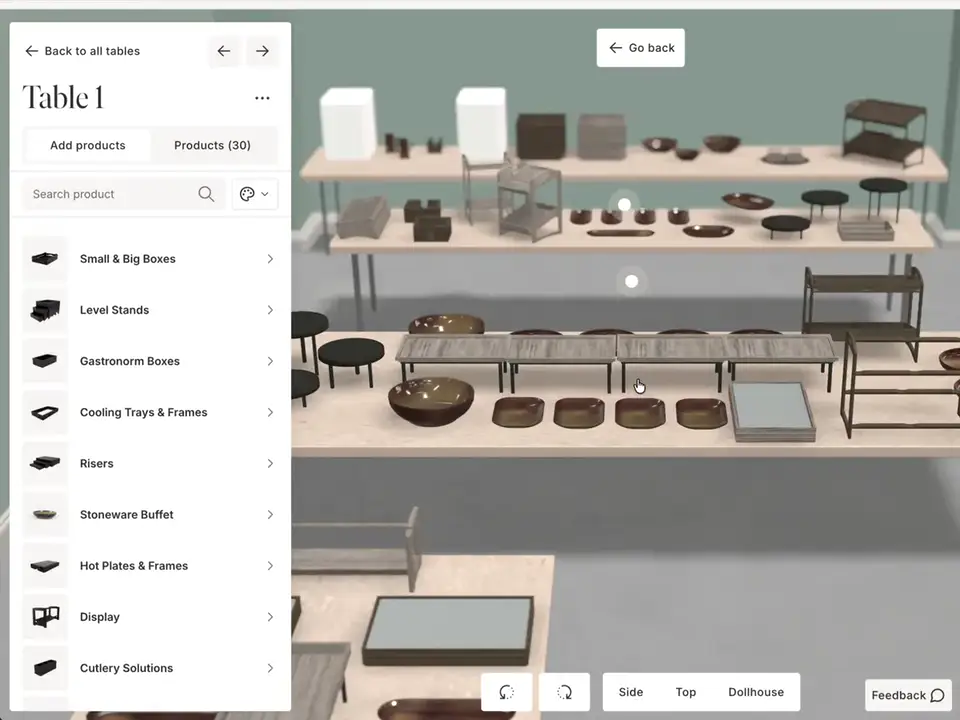
- Ingest synthetic events, normalize fields, display sources and timestamps, filter a map or 3D scene, raise an alert, replay the timeline and acknowledge the event.
- What it delivers
- A working operator view, sample API response and documented data model.
- How it will be measured
- Event volume, end-to-end latency, tested object count, frame rate, hardware and task completion. Targets until measured.
- Evidence
- Planned: A 60 to 90 second recording, still screenshots, an architecture thumbnail and a short technical evidence sheet, with a readable explanation for visitors who cannot run the demonstration.